Beyond Fairness: Reparative Algorithms to Address Historical Injustices of Housing Discrimination in the US
![a historical map of boston outling different neighborhood and housing zones in different colors](https://ssrc.mit.edu/wp-content/uploads/2023/04/beyondfairnessmap.jpg)
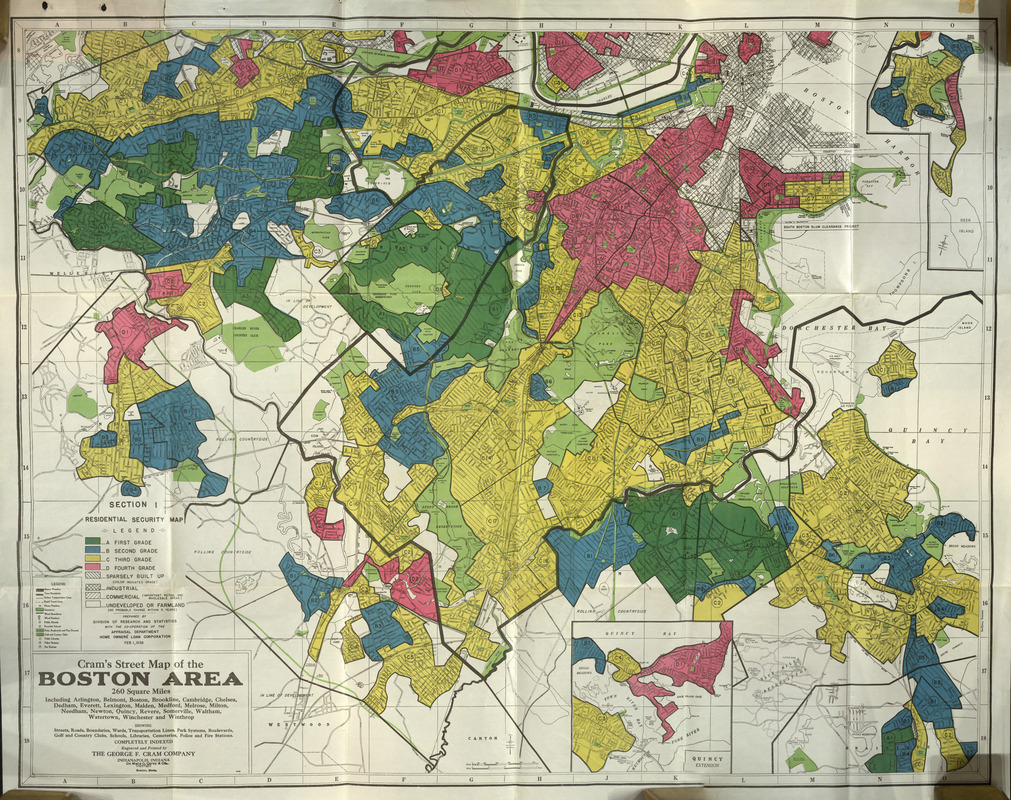
Fairness in Machine Learning (ML) has mostly focused on interrogating the fairness of a particular decision point with assumptions made that the people represented in the data have been fairly treated throughout history. However, fairness cannot be ultimately achieved if such assumptions are not valid. This is the case for mortgage lending discrimination in the US, which should be critically understood as the result of historically accumulated injustices that were enacted through public policies and private practices including redlining, racial covenants, exclusionary zoning, and predatory inclusion, among others.
With the erroneous assumptions of historical fairness in ML, Black borrowers with low income and low wealth are considered as a given condition in a lending algorithm, thus rejecting loans to them would be considered a “fair” decision even though Black borrowers were historically excluded from home-ownership and wealth creation.
To emphasize such issues, we introduce case studies using contemporary mortgage lending data as well as historical census data in the US. First, we show that historical housing discrimination has differentiated each racial group’s baseline wealth which is a critical input for algorithmically determining mortgage loans. The second case study estimates the cost of housing reparations in the algorithmic lending context to redress historical harms because of such discriminatory housing policies.
Through these case studies, we envision what reparative algorithms would look like in the context of housing discrimination in the US. This work connects to emerging scholarship on how algorithmic systems can contribute to redressing past harms through engaging with reparations policies and programs.
RESEARCH AREAS

![line drawing of the cross section of a brain when looking from the top with a square with the letters "AI" in the middle of it](https://ssrc.mit.edu/wp-content/uploads/2023/11/Artificial-Intelligence.png)
Artificial Intelligence
![line drawing of a computer microchip - a box with four lines coming out of each side and a smaller box in the center with the bottom right corner angled](https://ssrc.mit.edu/wp-content/uploads/2023/11/Computation-1.png)
Computation
![line drawing of a magnifying glass with ones and zeroes inside of it](https://ssrc.mit.edu/wp-content/uploads/2023/11/Data-Science.png)
Data Science
![line drawing of two arrows pointing in different directions with a magnifying glass looking at the tail end of one of them](https://ssrc.mit.edu/wp-content/uploads/2023/11/Info-and-Decision.png)
Info & Decision
![a line drawing graphic of four people figures (one at the top, one at the right, one at the bottom, and one at the left) connected by circular lines between them](https://ssrc.mit.edu/wp-content/uploads/2023/11/InstitutionalBehavior.png)
Institutional Behavior
![line drawing of a DNA double helix](https://ssrc.mit.edu/wp-content/uploads/2023/11/Healthcare-Medicine.png)
Life Sciences
![line drawing of a head in profile with a microchip overlaying the brain area of the head](https://ssrc.mit.edu/wp-content/uploads/2023/11/Machine-Learning.png)
Machine Learning
![line drawing of a bar graph with a line graph over it](https://ssrc.mit.edu/wp-content/uploads/2023/11/Statistics.png)
Statistics
![line drawing of a light bulb with the outline of a gear around the glass part of the bulb](https://ssrc.mit.edu/wp-content/uploads/2023/11/Systems-Innovation.png)
Systems Innovation
![line drawing of a cloud in the top of the image with three lines coming down out of it going to line drawings of a phone, laptop, and tablet](https://ssrc.mit.edu/wp-content/uploads/2023/11/Systems-and-Networking.png)
Systems & Networking
IMPACT AREAS
![line drawing of a stack of computer servers connected to each other](https://ssrc.mit.edu/wp-content/uploads/2023/11/Big-Data.png)
Big Data
![line drawing of three intersecting circles, one with a dollar symbol, one with a euro symbol, one with a bitcoin symbol](https://ssrc.mit.edu/wp-content/uploads/2023/11/Finance.png)
Finance
![line drawing of a heart with a one pulse line in the middle of it](https://ssrc.mit.edu/wp-content/uploads/2023/12/Healthcare-1.png)
Healthcare / Medicine
![line drawing of a train trestle bridge with three columns underneath and an arched span across the top](https://ssrc.mit.edu/wp-content/uploads/2023/11/Infrastructure-2.png)
Infrastructure
![line drawing of three people figures (one top center, one bottom left, and one bottom right) with a circle in the center between them and lines connecting each figure to the center circle](https://ssrc.mit.edu/wp-content/uploads/2023/11/SocialNetworks.png)
Social Networks
![](https://ssrc.mit.edu/wp-content/uploads/2023/11/Urban-Systems.png)